This article shares our Tactical Asset Allocation strategy for 2024, tailored for a conservative risk profile. We define a conservative strategy as a portfolio with a 5-year average volatility of 8%-11%. Our strategy combines a well-diversified portfolio structure providing broad exposure to different markets and asset classes with tactical allocations based on the current market context. We prioritize using the cheapest ETFs available to implement the strategies, ensuring they are a good representation of the asset class.
Asset Class Distribution
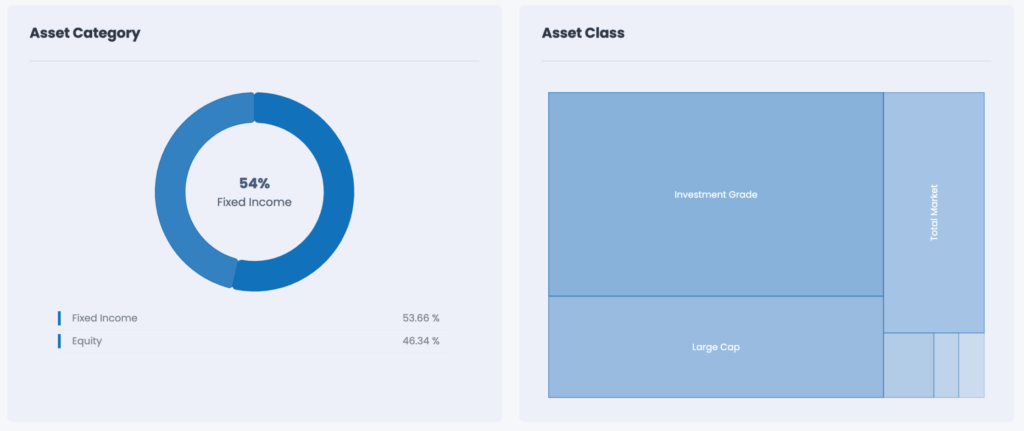
The asset allocation strategy for this conservative portfolio is 46% equity, 54% fixed income, and 0% commodities. It aims to balance capital preservation and income generation with some potential for growth. The equity allocation provides modest exposure to stocks for long-term appreciation, while the majority allocated to fixed income securities offers stability and regular income. The absence of commodities indicates a deliberate avoidance of their volatility and also that we think there is no great potential for a price rally. This allocation strategy suits investors seeking a cautious approach with a focus on mitigating risk.
Allocation
Equity: 46%
Fixed Income: 54%
Commodity: 0%
CITEC’s Asset Analysis
Equity
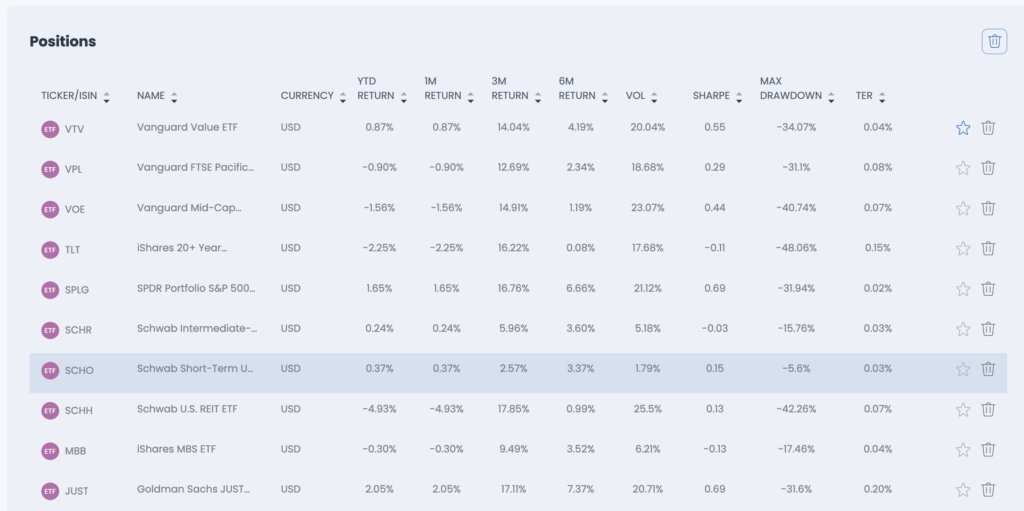
This equity portion of the portfolio displays a mix of strategic allocations to broad market indices, such as the S&P 500, along with tactical bets on specific regions and investment styles. Here are some comments on the composition:
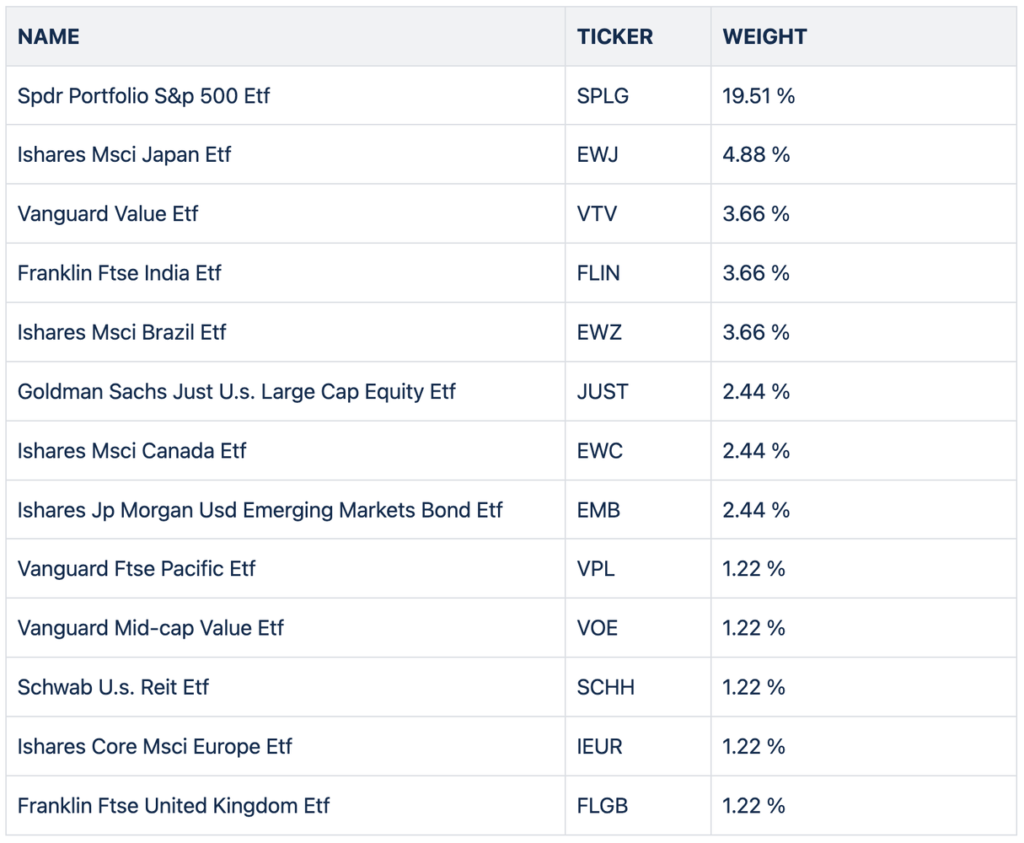
- US Large Cap Exposure: The largest allocation in the equity portion is towards the SPDR Portfolio S&P 500 ETF (SPLG), representing 19.51% of the portfolio. This indicates a significant allocation to the US large-cap equity market, providing exposure to some of the largest and most established companies in the world. This allocation suggests confidence in the stability and growth potential of US large-cap stocks.
- Tactical Bets on Value Stocks: The portfolio includes an allocation to the Vanguard Value ETF (VTV), which focuses on value-oriented US stocks. This suggests a tactical bet on undervalued companies that may have the potential for long-term appreciation. This allocation reflects a belief in the potential for value stocks to outperform growth stocks over the investment horizon.
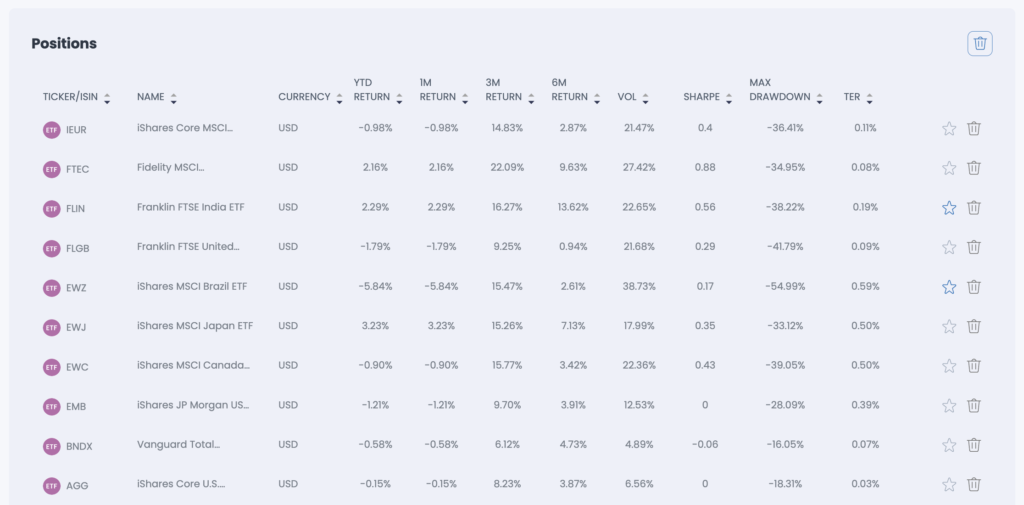
- Strategic and Tactical Allocation to International Markets: The portfolio includes allocations to specific international regions such as Japan, India, Brazil, Canada, Europe, and the United Kingdom. The allocations to iShares MSCI Japan ETF (EWJ), Franklin FTSE India ETF (FLIN), and iShares MSCI Brazil ETF (EWZ) indicate tactical bets on regions believed to have great potential. These allocations suggest a belief in the undervaluation of Japanese and Brazilian stocks, as well as the favorable economic trends in India.
- Diversification Across Regions: The inclusion of ETFs covering various regions such as Canada, Europe, and the United Kingdom provides diversification benefits by spreading exposure across different geographic areas. This can help mitigate risks associated with regional economic downturns or geopolitical events.
- Sector Diversification: While the portfolio focuses on specific regions, it also includes exposure to different sectors such as real estate (REITs) and mid-cap value stocks. This diversification across sectors can help reduce concentration risk and capture opportunities across different segments of the market.
Overall, this equity portion of the portfolio combines strategic exposure to US large-cap stocks with tactical bets on undervalued regions and value-oriented investment styles. The inclusion of international exposures adds diversification benefits and potential growth opportunities. However, investors should carefully monitor these tactical allocations and ensure they align with their investment objectives, risk tolerance, and time horizon. Regular review and adjustment of the portfolio may be necessary to maintain desired allocations and adapt to changing market conditions.
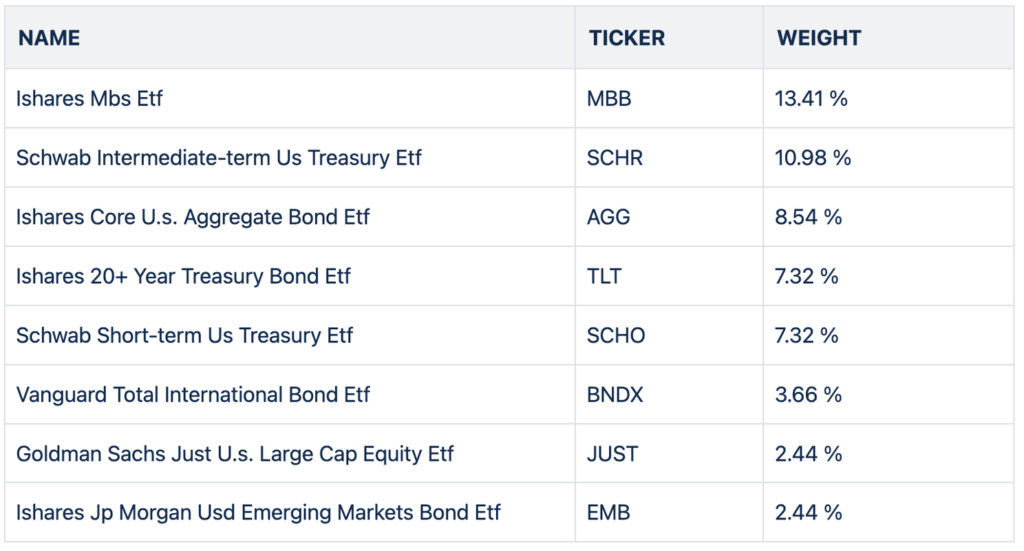
Fixed Income
The fixed income component of this portfolio comprises various bond ETFs, with a strategic allocation aimed at preserving capital while also seeking potential upside opportunities. Here’s an explanation:
- iShares MBS ETF (MBB) – 13.41%:Mortgage-backed securities (MBS) are debt securities backed by pools of mortgage loans.This allocation suggests a bet on the potential upside of MBS, as they are considered relatively safe assets with steady cash flows. Additionally, MBS can offer attractive yields compared to other fixed income securities.
- Schwab Intermediate-term US Treasury ETF (SCHR) – 10.98%:Intermediate-term US Treasury ETFs invest in US Treasury securities with maturities ranging from 3 to 10 years.This allocation indicates a belief in the potential of intermediate-term Treasuries to provide stability and moderate returns. It also suggests a bet on Treasuries as a safe haven asset in times of economic uncertainty.
- iShares Core U.S. Aggregate Bond ETF (AGG) – 8.54%:AGG tracks the performance of the Bloomberg Barclays U.S. Aggregate Bond Index, providing exposure to a broad range of US investment-grade bonds.This allocation indicates a strategic investment in a diversified portfolio of US investment-grade bonds to preserve capital and generate income.
- iShares 20+ Year Treasury Bond ETF (TLT) – 7.32%:TLT invests in long-term US Treasury securities with maturities exceeding 20 years.This allocation reflects a bet on long-term Treasuries, potentially due to their historical role as a hedge against economic downturns and as a safe haven asset during periods of market volatility.
- Schwab Short-term US Treasury ETF (SCHO) – 7.32%:Short-term US Treasury ETFs invest in US Treasury securities with maturities of less than 3 years.This allocation suggests a focus on short-term Treasuries for liquidity, safety, and relatively stable returns, especially in the current low-interest-rate environment.
Overall, this fixed income component of the portfolio demonstrates a strategic allocation across various types of bond ETFs, including mortgage-backed securities and Treasuries, to achieve capital preservation, generate income, and potentially benefit from specific market conditions such as economic crises or interest rate movements.
Geographic Exposure
This portfolio’s geographic exposure shows a strong focus on the United States, comprising 75.46% of investments. Smaller allocations are made to Japan (5.89%), Brazil (3.6%), India (3.54%), Canada (2.59%), the UK (1.66%), and other European countries (less than 1% each). This distribution indicates a significant reliance on the US market for growth and stability, with limited but strategic diversification into other global regions.
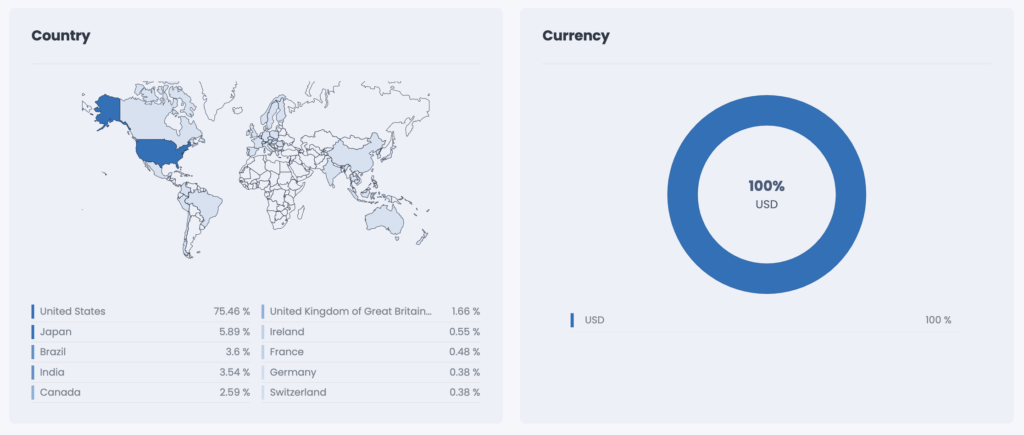
CITEC’s Country & Currency Analytics
Sector
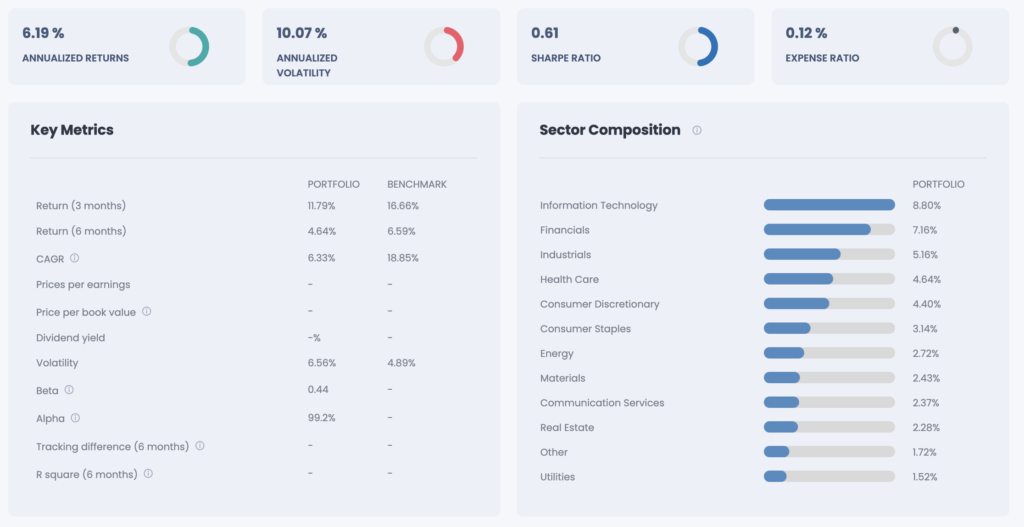
CITEC’s Sector & Key Metric Analytics
Historic Performance
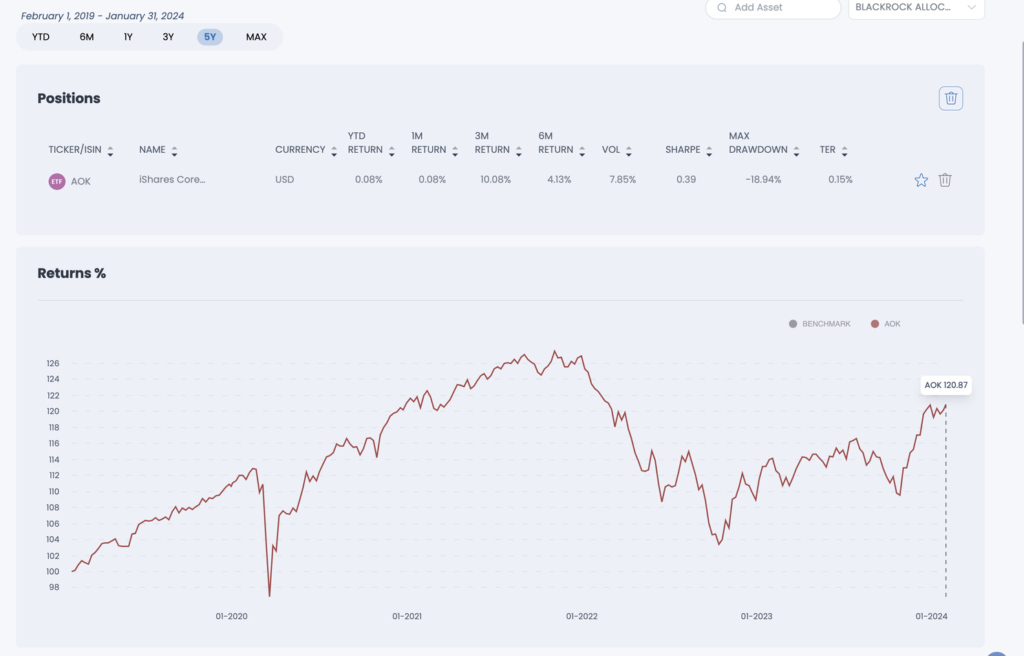
The portfolio’s backtest reveals an impressive return of 31% over the last 5 years, exhibiting a volatility of 10% and a maximum drawdown of 17.56%. This performance significantly outperforms the iShares Core Conservative allocation, which achieved a return of 21%, displayed a volatility of 8%, and experienced a maximum drawdown of -18.94%.
Backtest
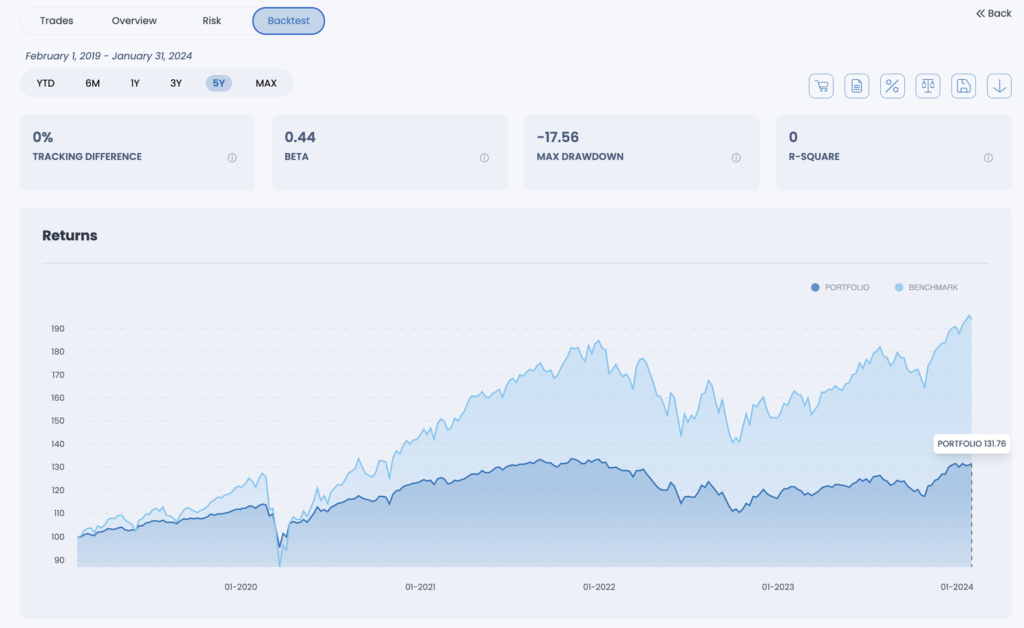
CITEC’s Backtest Analytics
iShares Core Conservative Allocation
CITEC’s Comparator
Assets Performance Over the Last 5 Years
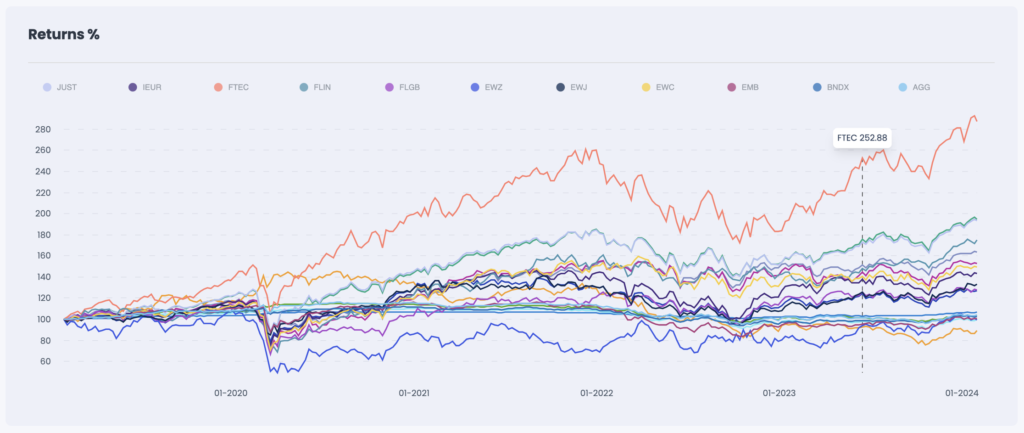
CITEC’s Return Analytics
Expense Ratio
We implemented the asset allocation strategy looking for the cheapest option available, allowing us to ridge an average expense ratio of 0.12%. This could have a huge impact over the long term vs. a standard portfolio with a ~1.0% expense ratio.